Snakemake NFL Report
A report generator for weekly NFL stats using Snakemake
Overview
As a fan of both sports and data, I was super excited to start this project. Of course, there was also the side benefit of possibly getting better at Fantasy Football 😂… But that is besides the point. To go back to the start, I had, at my work, been tasked with learning Snakemake for automating our bioinformatics pipelines. And while I had been making progress at that job, I wanted to cement my understanding of the system (and also experiment with report generation).
I therefore figured that there is no better way to do this than with an interest of mine; NFL football. To start out, I had to find an appropriate resource. Thankfully, someone on Reddit (where else) had the source I needed.
Setting it all up
And there it was; my starting point. In particular, I wanted to see, for a particular date,(corresonding to the Tuesday post-weekend to get all data for a week), which players were leading the way for various statistics.
Here are the stats I was interested in (defined at top of the Snakefile):
CATEGORIES = ['Passing_Yards','Rushing_Yards','Receiving_Yards','Total_Tackles','Sacks','Kickoff_Yards','Interceptions','Passing_Touchdowns','Quarterback_Rating','Rushing_Touchdowns','Receptions','Receiving_Touchdowns','Total_Points','Total_Touchdowns','Punt_Yards']Creating the Pipeline
I then created a Python script to fetch data by using these (as well as date) as snakemake wildcards. Of course, these results also dependd on the season, so I also added season as a parameter for the script. I did the same for plotting these results (using altair as described by the docs).
Eventually, I decided to also call the API to retrieve scores for a given week and updates records for all teams (why not?!). Of course, the scores required a new weeknum parameter to get the week’s scores, so I did that.
Report Generation
This was cool and all (it creates a lot of results in the data,scores, team_records, and plots folders), but lacked refinement. That’s where Datavzrd comes in! I was hoping to display all old reports via the subdirectories, but this didn’t seem possilbe. Thankfully, the maintainer was quite helpful with helping me figure this out: https://github.com/datavzrd/datavzrd/issues/1085.
Eventually, I decided to just create each week’s report one at a time. This report includes all of the plots and html files for each (leaders, scores, records). Note that the “leaders” index file has a table for all categories:
rule view_leaders_with_datavzrd:
    input:
        Interceptions = "data/{DATE}/Interceptions.csv",
        Kickoff_Yards = "data/{DATE}/Kickoff_Yards.csv",
        Passing_Touchdowns = "data/{DATE}/Passing_Touchdowns.csv",
        Passing_Yards = "data/{DATE}/Passing_Yards.csv",
        Punt_Yards = "data/{DATE}/Punt_Yards.csv",
        Quarterback_Rating = "data/{DATE}/Quarterback_Rating.csv",
        Receiving_Touchdowns = "data/{DATE}/Receiving_Touchdowns.csv",
        Receiving_Yards = "data/{DATE}/Receiving_Yards.csv",
        Receptions = "data/{DATE}/Receptions.csv",
        Rushing_Yards =  "data/{DATE}/Rushing_Yards.csv",
        Rushing_Touchdowns =  "data/{DATE}/Rushing_Touchdowns.csv",
        Sacks = "data/{DATE}/Sacks.csv",
        Total_Points = "data/{DATE}/Total_Points.csv",
        Total_Tackles = "data/{DATE}/Total_Tackles.csv",
        Total_Touchdowns = "data/{DATE}/Total_Touchdowns.csv",
        config="resources/datavzrd/summary.yaml"
    output:
        report(
            directory("results/tables/{DATE}/leaders"),
            htmlindex="index.html",
            caption="workflow/report/stats.rst",
            category="Tables"
        ),
    wrapper:
         "v8.0.0/utils/datavzrd"
I also create “dead end” branches in the GitHub repo for each week and then just run it. This way I have a record of each run of the pipeline and can go back into the archive if needed. Running it is now (usually) as simple as:
- Run the Snakemake pipeline
snakemake --cores {CORES} --use-conda - Create the report
snakemake --sdm conda --report report.zip - Done!
Inputs
Here is the (very easy!) YAML that connects it all together:
#made to run on Tuesdays after the week is over
year: 2025 # season (2023 for 23/24 Season, 2024 for 2024/25 Season,etc.)
date: 2025-11-25 # date in YYYY-MM-DD format
weeknum: 12 # weeknumber in order to fetch scores
Outputs
You can find a full example report result here! I hope to update this on a weekly basis 🙂
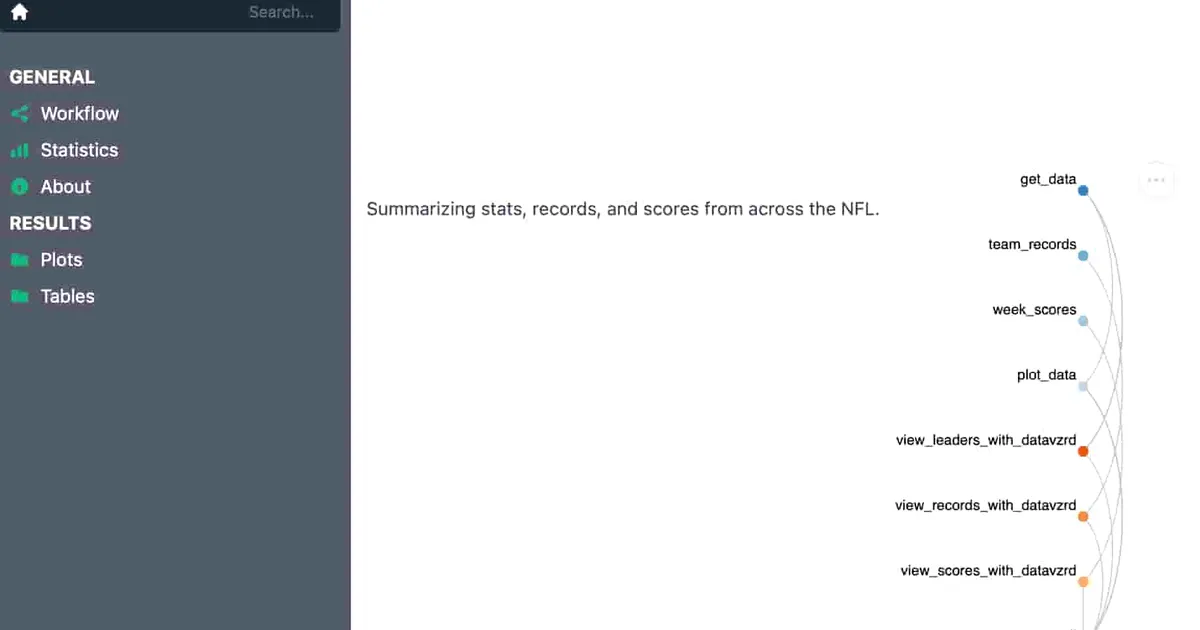
Image: screenshot of a report generated by the Snakemake workflow